World & Continents Goals (SDGs) Progress Situation
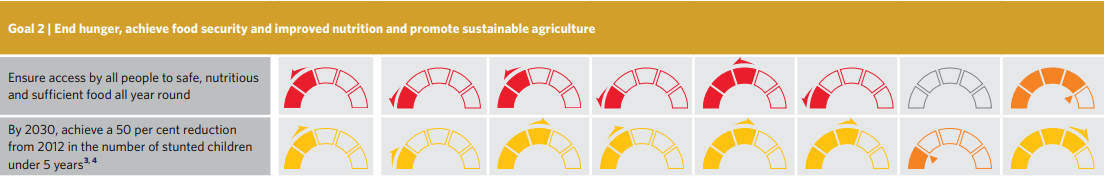
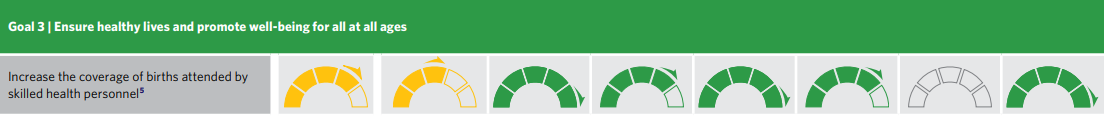
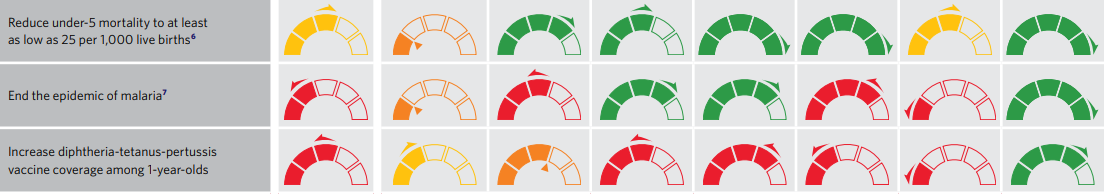
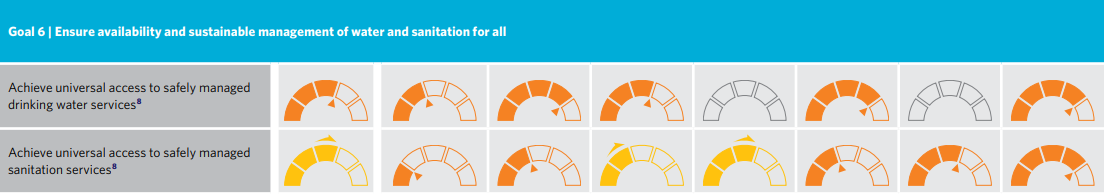
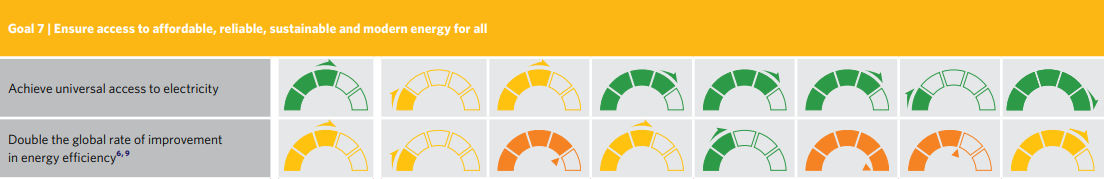
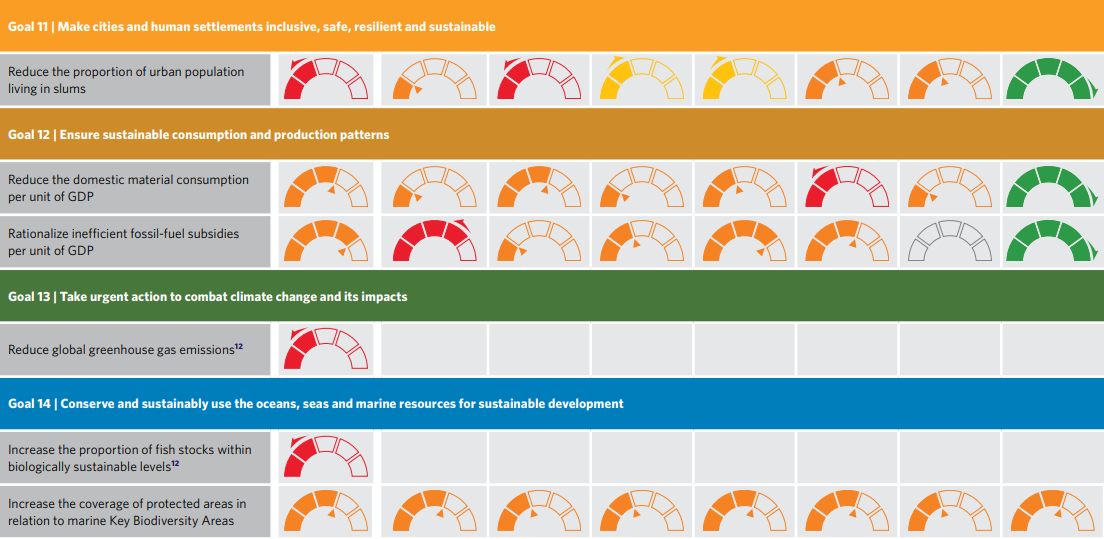
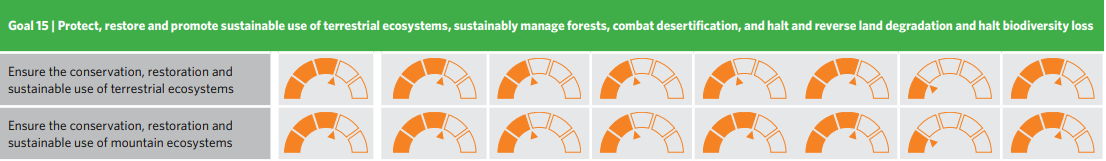
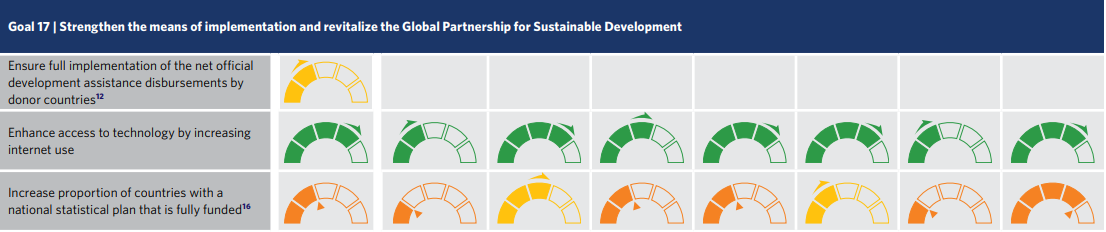
Read moreThe chart shown here is to be considered a true “snapshot” of the progress that the World and, more specifically, the Continents, have managed to achieve on the Sustainable Development Goals of the 2030 Agenda. Although there are actually 17 Goals, Planethealthcheck has deliberately focused on those closely related to the health of Planet “Earth”. The assessment of progress is based exclusively on extremely up-to-date data which, in fact, also take into account the impacts caused by the COVID-19 pandemic.
From the chart the user can also see, unfortunately, the abrupt slowdown, or “deterioration” that some targets have suffered due not only to the pandemia but also to war conflicts and, of course, climate change. Urgent action is sorely needed: the recent crises have made the challenges that all the countries of the World must undertake to save the Planet more difficult. All the countries of the World, none excluded, must “accelerate” and coordinate with each other to reach and implement, as soon as possible, the Sustainable Development Goals sanctioned in 2015 during the Paris meeting on Climate. The path is compulsory if we want to avoid the devastating impacts that our Planet is at risk of suffering. It is possible to “get back on track” but a big common effort is required right now!
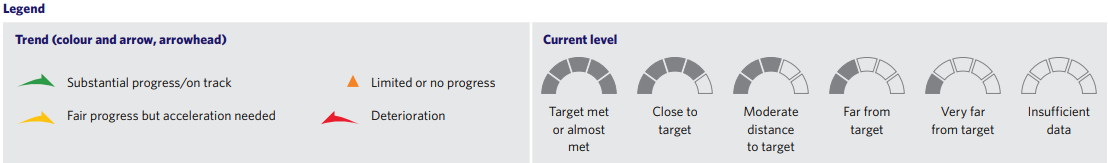
The information in the chart contains two types of information: the first, deliberately uses the colours of a traffic light to indicate “trend”, i.e. to measure, for example, the progress (green) or regress (red) achieved by the target; the second information, on the other hand, shows an assessment of the level of development (result) achieved through the use of a gauge indicating the distance to the target itself. All indications in the chart use information (made public by International and Scientific Organisations, Institutions and Universities) available since June 2022.
World & Continents Goals Progress Chart


Notes & Sources
Notes:
* The category “Pacific island countries” refers to Oceania excluding Australia and New Zealand. The category “developed countries” includes Europe, Northern America, Australia and New Zealand.
3 Trend assessment uses a baseline year of 2012.
4 Level assessment is based on 2020 data, with five levels of stunting prevalence: very high (1 bar), high (2 bars), moderate (3 bars), low (4 bars), and very low (5 bars).
5 Trend assessment uses a baseline year of 2011.
6 Trend assessment uses a baseline year of 2010.
7 Trend assessment is based on the WHO Global Technical Strategy for Malaria 2016–2030, which is reducing malaria case incidence by at least 90 per cent by 2030. Level assessment is classified into five levels of malaria case incidence: very high (1 bar), high (2 bars), moderate (3 bars), low (4 bars), and target achieved (5 bars).
8 Assessment for “developed countries” refers to Europe and Northern America only.
9 Level assessment is based on the level of energy intensity, with five levels: high (1 bar), medium-high (2 bars), medium (3 bars), medium-low (4 bars), and low (5 bars).
12 Assessment is only at the global level.
13 Assessment for “developed countries” refers to Europe only.
14 Level and trend assessment are based on the Red List Index and regional disaggregations of the index.
16 Trend assessment is based on progress from 2017 to 2020.
For regional groupings, country data and technical note for the progress chart, please refer to: https://unstats.un.org/sdgs. Country experiences in each region may differ significantly from the regional average. Due to updated data and revised methodologies, this Progress Chart is not comparable with previous versions.
Sources:
United Nations, based on the latest available data and estimates as of June 2022: provided by: Department of Economic and Social Affairs (DESA), Food and Agriculture Organization (FAO), International Energy Agency (IEA), International Labour Organization (ILO), Inter-Parliamentary Union (IPU), International Renewable Energy Agency (IRENA), International Telecommunication Union (ITU), International Union for Conservation of Nature (IUCN), Office of the United Nations High Commissioner for Human Rights (OHCHR), Organization for Economic and Cooperation and Development (OECD), Partnership in Statistics for Development in the 21st Century (PARIS21), Secretariat of the United Nations Framework Convention on Climate Change (UNFCCC), United Nations Children’s Fund (UNICEF), United Nations Educational, Scientific and Cultural Organization (UNESCO), United Nations Entity for Gender Equality and the Empowerment of Women (UN-Women), United Nations Environment Programme (UNEP), United Nations Human Settlements Programme (UN-Habitat), United Nations Industrial Development Organization (UNIDO), United Nations Office on Drugs and Crime (UNODC), World Bank Group, World Health Organization (WHO).
The chart has been compiled by the Statistics Division, Department of Economic and Social Affairs, UN.